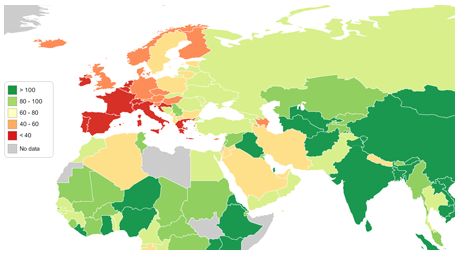
The desktop version of StatWorld has just been released, a free educational tool through which world statistics can be explored in the form of interactive maps and graphs.
StatWorld can be used to explore hundreds of maps and graphs covering a wide range of topics, including education, environment, economy, health, ICT and language.
 Today
Today  Infographics are often confused with data visualizations. Differences are not so apparent to a casual observer, and there is a lot of misinformation out there. It is commonly thought that these two are completely different - but they are not. Both are visual representations of data.
 SDMX or Statistical Data and Metadata eXchange has become an
  Unless you need to look up exact values or do some calculations, visualizations are almost invariably better than tables of numbers. If you are not already visualizing your data, you are missing important insights.
 e are happy to announce that
  StatSilk founder Frank van Cappelle recently provided his insights on the benefits of data visualization, as part of an expert interview series at Podbox.