
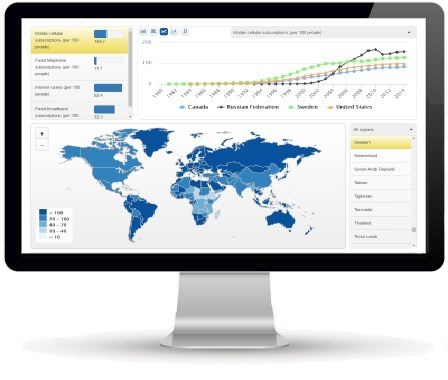
- Easily switch between multiple visualization types, automatically generated from your data.
- Modular design, enabling highly customizable dashboards - just add, resize, and drag-and-drop panels into place.
- Keep things simple with a single data file for any number of dashboards.
- Multiple filter options: filter by time ranges, map regions, variable groups, categories and sub-categories.
- Embed text panels or web-pages to tell stories with your data.
- Create interactive stories, enabling users to navigate through customized visualizations.
- Easily navigate through dozens or hundreds of indicators using multi-level menus and our fuzzy search system (approximate matching of search terms).
-
Create zoomable map regions for enhanced spatial analysis.
- Choose from various export formats, including SVG for high quality, publication-ready images.
See also the product feature comparison.
Visualizing and mapping your data is a two-step process. In the first step, the StatPlanet Data Manager sets up the map you wish to use (see: obtaining free maps). In the second step, the StatPlanet Data Manager automatically imports your data. During this process three key dimensions of your data are modeled: the geographic dimension (data linked to map areas), the indicator dimension (topics or variables in your data file), and the time dimension (if any). Through this model, interactive maps and visualizations are automatically generated using best-practice data visualization principles.
StatPlanet Cloud is a SaaS application, so the application itself does not need to be hosted on your web server. Maps and data files are hosted on your own web server. At the user-end, the three components come together in the web-browser, integrating the map and data files within the StatPlanet Cloud application.
Information flows one way only, from the cloud/servers to the user's computer or device. No information is uploaded or otherwise recorded in the cloud.
StatPlanet Cloud requires an annual or bi-annual subscription. See the subscription plans for more details, and the discount eligibility criteria for non-profit organizations and education institutions.
Maps
Modular design, flexible layout
StatPlanet Cloud has a modular design, which means that you can have a full dashboard with multiple panels (map, graph, indicator selection, etc.) on one web-page, and on other web-pages may choose to display just one or two panels. For example, you may wish to embed a specific type of interactive graph for a particular indicator within one web-page, and in another web-page display a map instead, for a different indicator. Unlimited dashboards with custom layouts can be constructed, while only having to maintain a single database, through which all maps and graphs are automatically generated. All that is required is to specify the required parameters for the dashboard, such as the indicator and visualization type. For technical details, see the StatPlanet Cloud API.
The layout of each dashboard can be easily customized. For a demo, please see:
To redesign the dashboard layout, click on any panel to drag and drop it into a new position. To resize a panel, click and hold the bottom-right corner of the panel.
The modular design also enables the layout to automatically adjust to the user's screen size. On smartphones and other small screen devices, for example, only one panel at a time will be shown.
Cloud-hosted or self-hosted
Your StatPlanet Cloud subscription gives you the flexibility to either host data and map files on your own server or in the cloud. A Gold or Platinum subscription provides access to a file management interface through which you can easily upload your files to our cloud servers. Should you prefer to host everything on your own server, that is possible as well. For more details, please contact us.
The new version is backward compatible with older versions of StatPlanet, including the desktop edition, and can use the exact same data files. However, any map files need to converted to GeoJSON format. This is a simple process which is covered in our tutorial. We provide a free map conversion service to StatPlanet Cloud subscribers.
For further information, please contact us.