
StatSilk's StatPlanet data visualization software has been used for a wide range of purposes, such as poverty mapping in Afghanistan, visualizing health risk factors in Australia, disseminating Kosovo census data, illustrating youth voting trends in the USA, and as a dashboard for analyzing performance metrics by companies such as Dell, eBay and Samsung. Below are a few examples of how our clients are using StatPlanet.
Featured
 |
OECD & World Bank Innovation Policy Platform: Built to facilitate international knowledge exchange and collaboration, the Innovation Policy Platform visualizes hundreds of indicators for over 120 countries. It covers policy-relevant demographic, economic, education, health, finance, ICT, innovation, science and technology indicators. |
National and sub-national
- Afghanistan: Using StatPlanet as a tool for policy analysis
Afghanistan Ministry of Economy, World Bank & Australian Aid
- Australia: Heart Maps and Health Risk Factors
Heart Foundation
- Belgium: Census Maps
Vrije Universiteit Brussel
- India: Rainfall Maps
Government of Andhra Pradesh
- Indonesia: Social Welfare Information System
Government of Indonesia
- Kosovo: Census Maps
Kosovo Agency of Statistics
- New Zealand: Auckland Census Area Health Stats
Auckland District Health Board
- Turkey: Istanbul Global Competitiveness Survey
Istanbul University
- USA: Youth Voting and Demographics by Congressional District
Civic Youth
Global and regional
Asian Development Bank
European Commission
HCSS (The Hague Centre for Strategic Studies (HCSS)
- GeoRisQ Monitor: Global developments, trends, risks and opportunities.
IEA (International Association for the Evaluation of Educational Achievement)
- Global 4th & 8th Grade Reading, Math and Science results - TIMSS and PIRLS studies.
IFPRI (International Food Policy Research Institute)
- Food Security CASE Maps: Interactive Climate, Agriculture, and Socio-Economic Maps
-
ReSAKSS-Asia Map Tool: Tracking and monitoring the overall performance of Asian countries, including Economic Trends, Malnutrition and Poverty, Agriculture and Food, Investments and Policy Commitments and Trade.
INDEPTH
- INDEPTHStats: Detailed health and demographic indicators for 20 low- and middle-income countries.
OECD
UN-DESA (United Nations Department of Economic and Social Affairs)
- Global Economic Outlook (GEO) Database
- Risk factors, Instability, Economic Vulnerability Index (EVI) Maps
UN-IIF (United Nations Integrated Implementation Framework)
- Platform for tracking progress on the Millennium Development Goals
- Video - demonstration of the platform, UN General Assembly - from 18:50 to 23:20.
UNIDO (United Nations Industrial Development Organization)
UNDP (United Nations Development Programme)
- Human Development Indicators - Interactive Map
- Human Development Data for the Arab States
- Custom apps developed in collaboration with Andy Thornton:
Human Development Index Trends and DIY HDI - Build Your Own Index
UNESCO (United Nations Educational, Scientific and Cultural Organization)
USAID
WHO:
World Bank
Other country level examples
- Afghanistan - Poverty Assessment Maps - World Bank
- France department maps - Actualitix
- UK maps of psychotic disorder for healthcare policy makers and planners - University of Cambridge
Customization examples
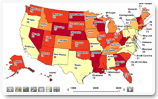 |
Interactive map with labels *The USA interactive state-level map comes bundled with StatPlanet |
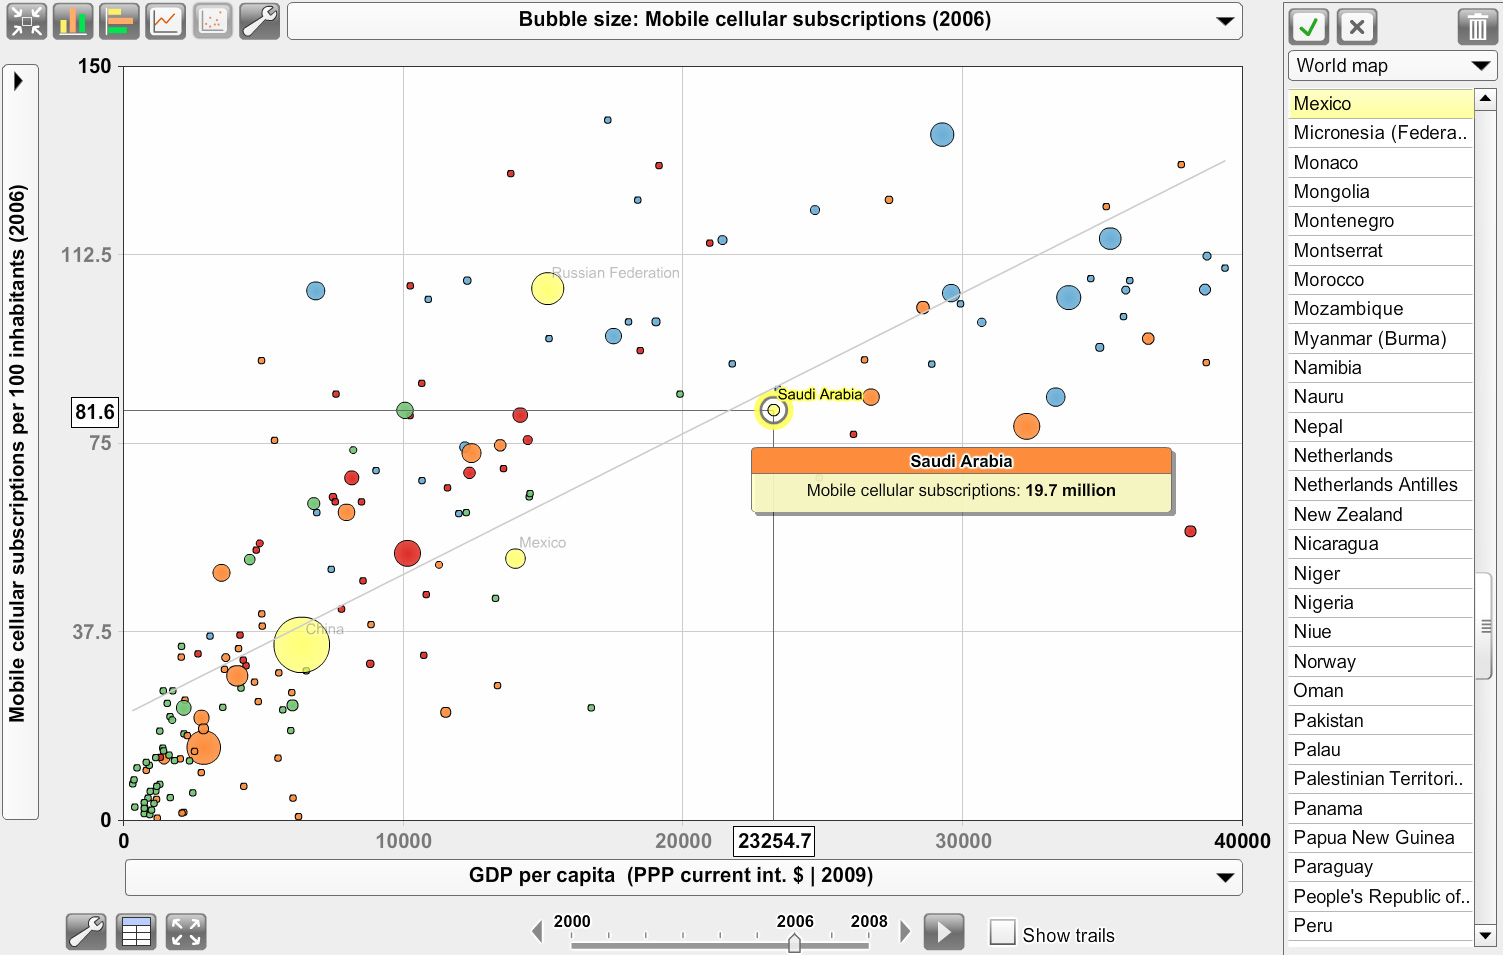 |
Interactive scatter plot *For a demo, see any of the featured examples above and select the 'scatter plot' icon |
 |
Point map with bullet graph Organization: Ministry of Education, Seychelles |
 |
Map with popup images Organization: EduTube |
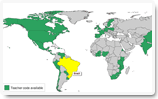 |
Map with web-links Organization: UNESCO-IIEP (Teacher Codes of Conduct - Map Portal) |
 |
Dark theme Customization: Interface colors |
 |
Africa - Interactive Map |
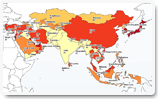 |
Asia - Interactive Map |
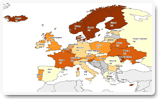 |
Europe - Interactive Map |
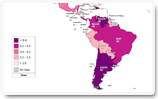 |
Latin America - Interactive Map |
 |
Middle East - Interactive Map |
 |
Custom Region Interactive Map |