StatTrends is a completely free desktop application for creating interactive charts and graphs, which can be used for both commercial and non-commercial purposes. For the mobile-compatible web version, please see StatPlanet Cloud (and demo).
Creating your own charts and graphs is easy. Just use Excel or other spreadsheet software to insert or import data. No programming is required.
Related software
- StatPlanet adds interactive mapping capabilities, and has the same powerful interactive graph capabilities as StatTrends.
- StatPlanet Cloud is the web version of StatTrends with optional mapping component.
StatTrends Features
StatTrends has support for the following interactive visualizations:
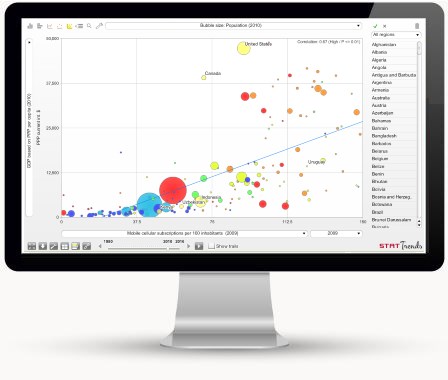
- Animated bubble charts (similar to Hans Rosling's Gapminder)
- Bar and column charts, including bullet charts
- Scatter plots or bubble charts
- Time series graphs
- Vertical bubble charts - a combination of the bar chart and the bubble chart
StatTrends empowers users to interact with and explore the data through the following features:
- Explore several indicators over time through the powerful bubble chart (similar in features to Gapminder and Google's Motion Chart). In addition to the x-axis and y-axis variables, a third variable can be displayed through bubble size. The 'bubbles' can be animated over time, and optionally 'trails' can be displayed to visualize trends for individual bubbles.
- Play time-based animation for all chart and graph types;
- Select and compare multiple indicators through drop-down menus;
- Select and highlight variables of interest, and optionally display additional information through popups;
- Customize the graph scale and colors (both within the StatTrends user interface, or pre-set using the included Data Editor);
- Organize lists of variables into groups, enabling users to easily switch between different groups of variables. A variable group can also be created by users through the StatTrends user interface;
- Maintains user selection when switching between different indicators and graph types.